Protect Democracy United – Voters of Tomorrow – Generation Lab — 2026 Poll
OVERVIEW
This report summarizes findings from a survey of 2,027 young people from across the United States. The study was conducted from February 26th to March 9th, 2026 and the margin of error is +/- 2.13 percentage points. Note that the information here is weighted, providing a representative view into the young American population between the ages of 18-29. The survey examined attitudes toward immigration enforcement, economic conditions, democratic institutions, civic engagement, and media consumption.
Three major themes emerge from the data with consistent patterns across the sample.
1) Views on ICE Are Broadly Negative — and Connected to a Wider Set of Concerns
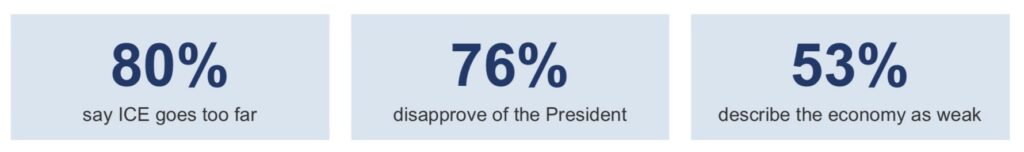
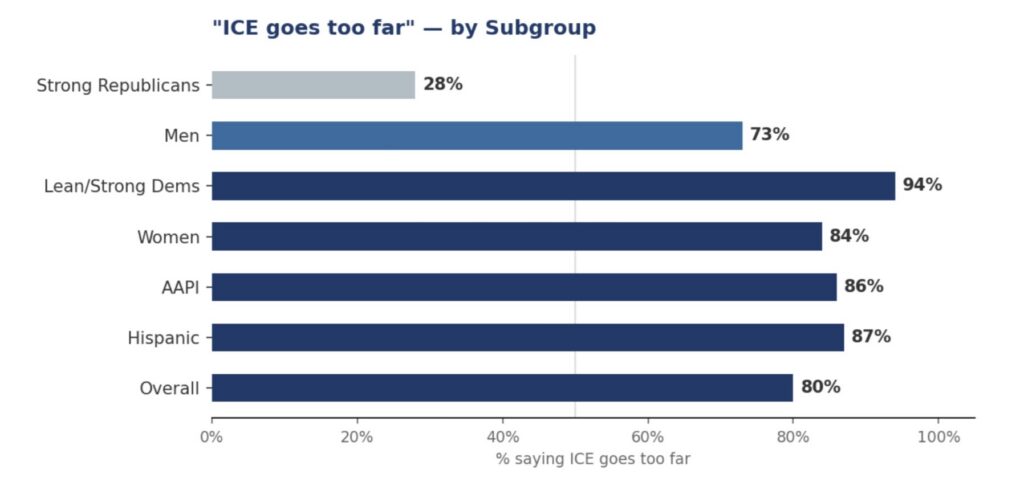
Concern about immigration enforcement is one of the most consistent findings in the dataset. Eight in ten respondents (80%) say that ICE goes too far in its efforts to address immigration — a figure that is stable across demographic subgroups.
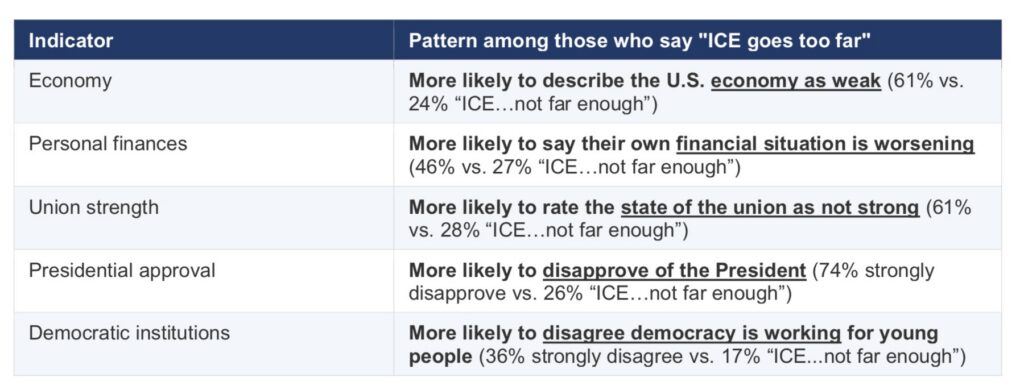
Importantly, views on ICE do not appear to be a standalone position. Respondents who say ICE goes too far cluster together on a range of other issues. Compared to those who say ICE does not go far enough, they are considerably more likely to describe the economy as weak, to report that their personal finances are getting worse, and to express dissatisfaction with democratic institutions. This pattern suggests that ICE opposition is part of a broader set of concerns about conditions in the country, rather than a single-issue stance.
Democratic variation is also notable. Hispanic respondents express the strongest concern — 87% say ICE goes too far, 74% strongly oppose a hypothetical detention facility in their community, and 67% describe the economy as weak. AAPI respondents register 86% opposition. Rural respondents, who are more moderate on other economic and approval questions, nonetheless register 74% opposition —suggesting this view is not confined to any single region or political orientation.
Opposition to Local Detention Centers
A related question asked respondents whether they would approve or disapprove of a migrant detention center being opened in their community. Opposition is distributed: 72% of all respondents disapprove, and approval stands at just 19% overall.
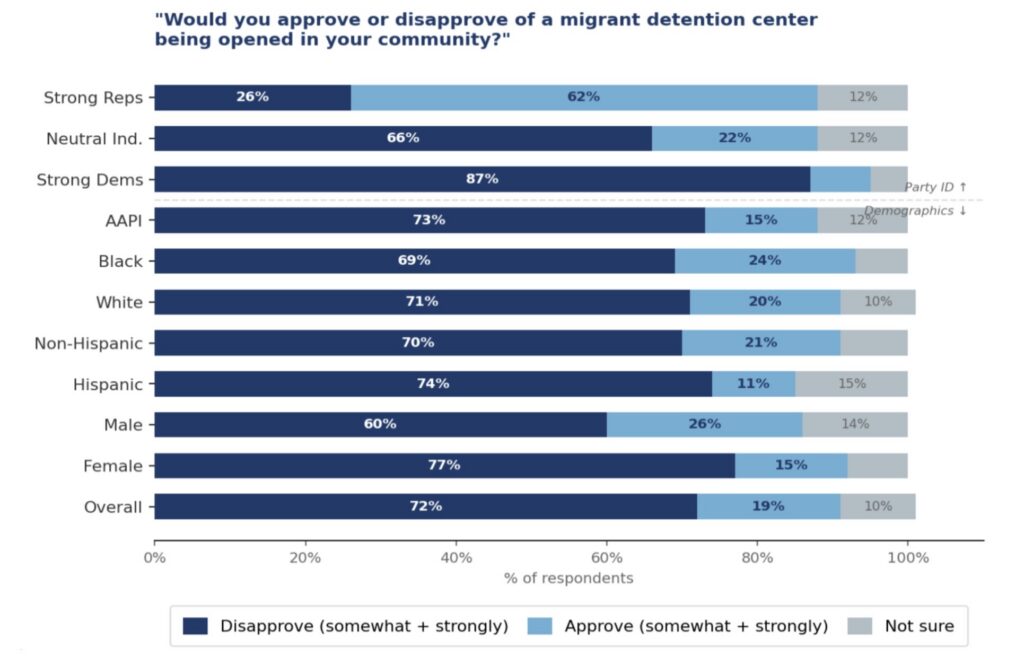
The partisan gap on this question is significant. Strong Democrats disapprove at 87%, compared to 26% of Strong Republicans — a 61-percentage-point difference. Across demographic subgroups, opposition is consistent: female respondents disapprove at 77% vs. 60% of male respondents, and Hispanic respondents disapprove at 74%. Opposition among White (71%), Black (69%), and AAPI (73%) respondents is similarly elevated, suggesting that resistance to local detention facilities is not concentrated in any single racial or ethnic group.
2) High Levels of Concern Have Not Translated Into Higher Voting Intent
One of the more notable patterns in the data is the gap between the breadth of concern about immigration enforcement and respondents’ stated voting intent. Opposition to ICE is widespread across the sample, but this does not reliably correspond to plans to vote.
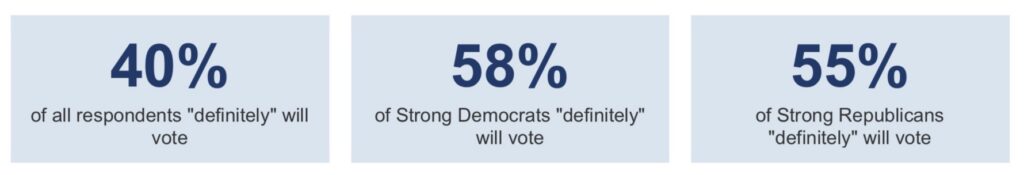
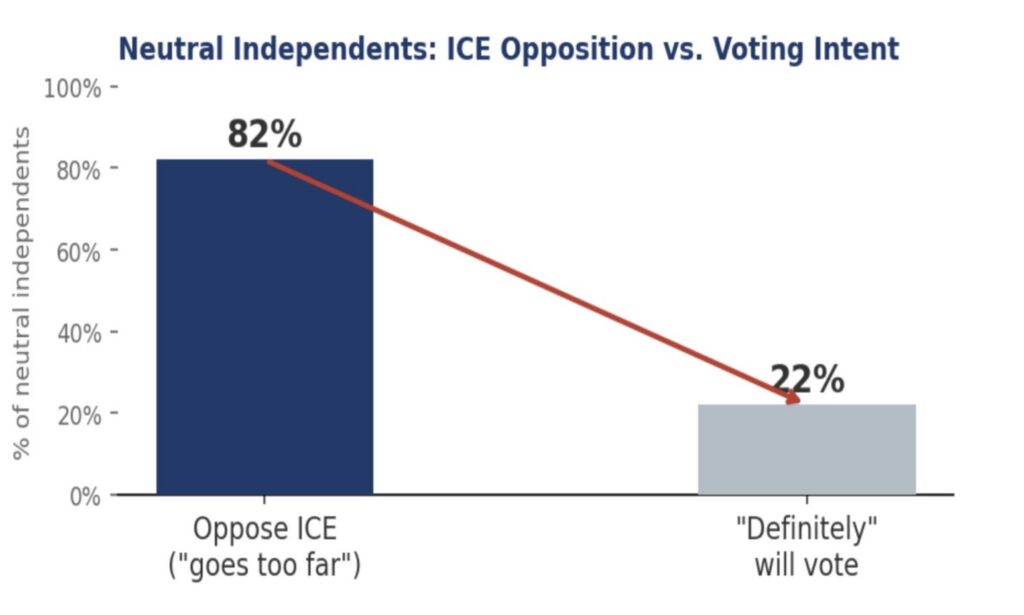
Strong partisans of both parties report notably higher voting intent than the overall sample average of 40%. The chart below breaks down definite voting intent among neutral independents — who, despite opposing ICE at 82%, are the least likely of any group to say they will definitely vote.
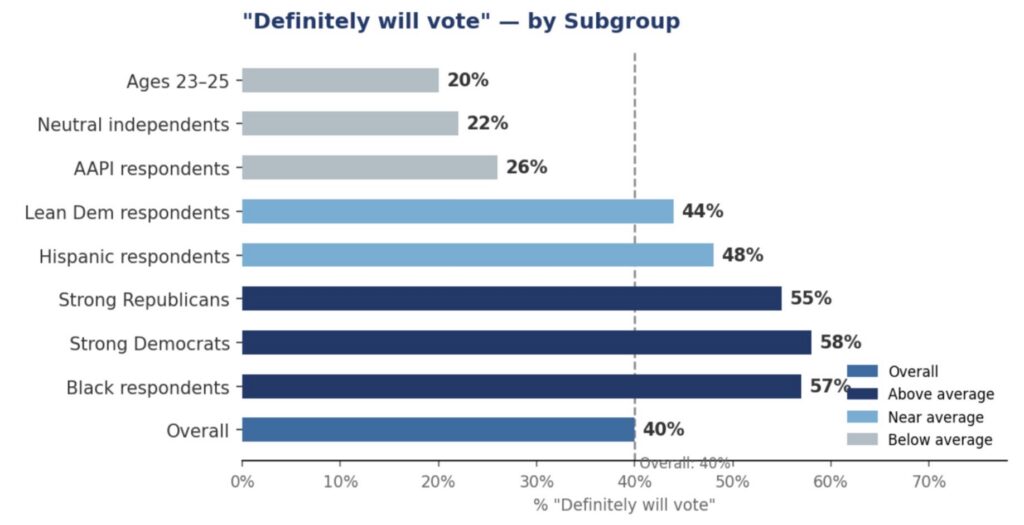
Voting Intent by Subgroup
Voting intent varies substantially across demographic groups. Black respondents and strong partisans of both parties report the highest rates of definite voting intent. AAPI respondents and neutral independents report the lowest.
Civic engagement takes forms beyond voting. Respondents report signing petitions, posting about political events online, and participating in mutual aid. Hispanic respondents show elevated civic engagement across nearly every measure. This suggests that high levels of concern are being channeled into some forms of participation, though the connection to voting engagement remains less consistent.
3) Support for Democratic Principles Is High; Confidence in Their Implementation Is Low
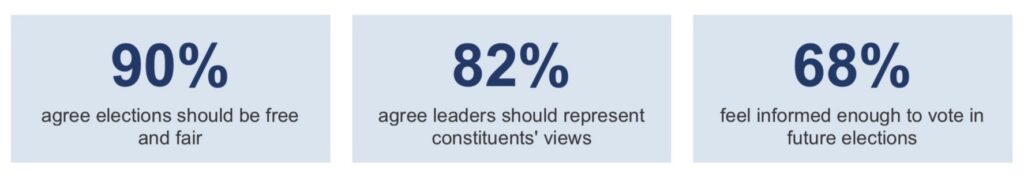
Respondents across the sample express broad support for core democratic principles. Large majorities agree that it is important for leaders to be chosen through free and fair elections (90% agree or strongly agree) and that leaders should reflect the views of those who elected them (82% agree or strongly agree). These figures are consistent across party identification, suggesting a broad consensus on democratic values.
However, confidence that these principles are being met in practice is considerably lower. The chart below shows how respondents assess three specific dimensions of democratic functioning: whether democracy is currently working well, whether democracy can address the country’s challenges, and whether elections are free and fair.
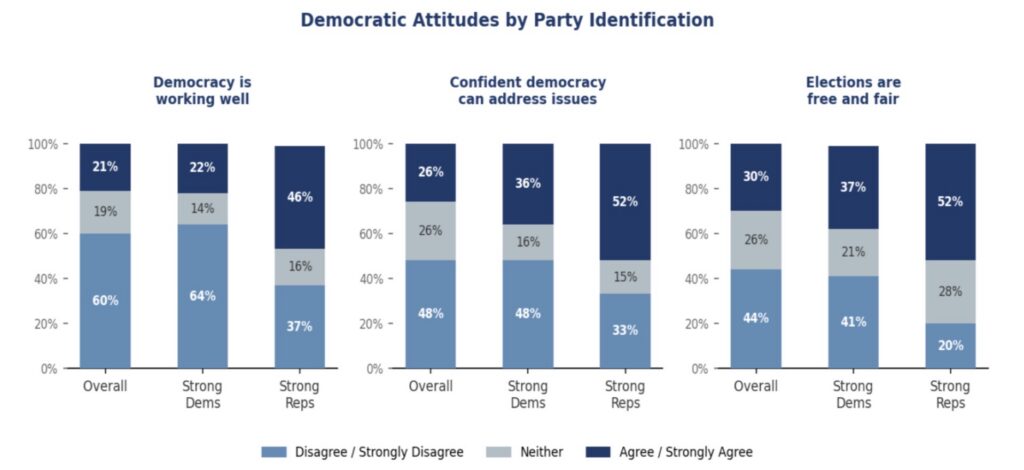
On each of these measures, majorities or near-majorities express doubt. Six in ten respondents (60%) disagree that democracy is currently working well for young people, including 64% of Strong Democrats and 37% of Strong Republicans. Nearly half (48%) are not confident that democracy can address the issues the country faces. On elections specifically, 44% of respondents disagree that elections are free and fair, compared to 30% who agree.
The survey also included questions on several specific democratic norms — separation of powers, the role of the military, and First Amendment protections — that provide additional context for how respondents understand democratic governance.
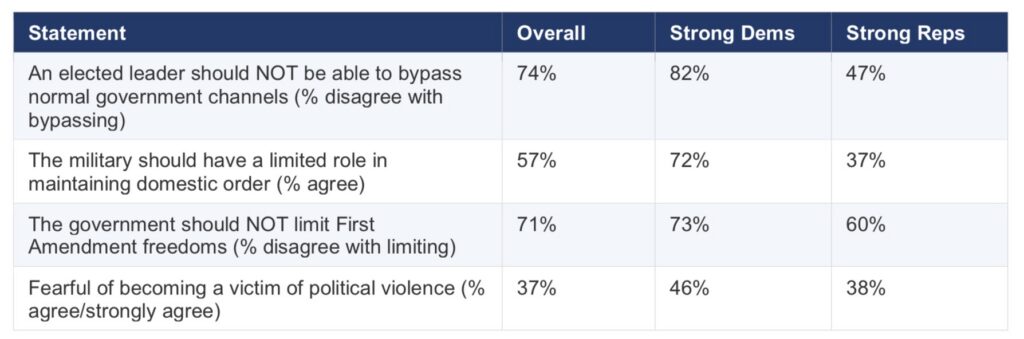
Support for these democratic guardrails is broadly positive across the sample, though with meaningful partisan variation. Three-quarters of respondents (74%) disagree that elected leaders should be able to bypass normal governmental channels — a figure that drops to 47% among Strong Republicans. Similarly, 57% overall agree the military should have a limited role in maintaining domestic order, compared to 72% of Strong Democrats and 37% of Strong Republicans. Opposition to government restrictions on First Amendment freedoms is more cross-partisan: 71% of all respondents and 60% of Strong Republicans disagree that such limits are appropriate.
On personal safety, 37% of respondents say they are fearful of becoming a victim of political violence — this is very similar across Strong Democrats (46%) and Strong Republicans (38%), suggesting that concern about political violence is not confined to one side of the partisan divide.
4) Significant Gender Differences in Political Views and Media Consumption
The survey reveals consistent differences between male and female respondents on both political attitudes and media usage.
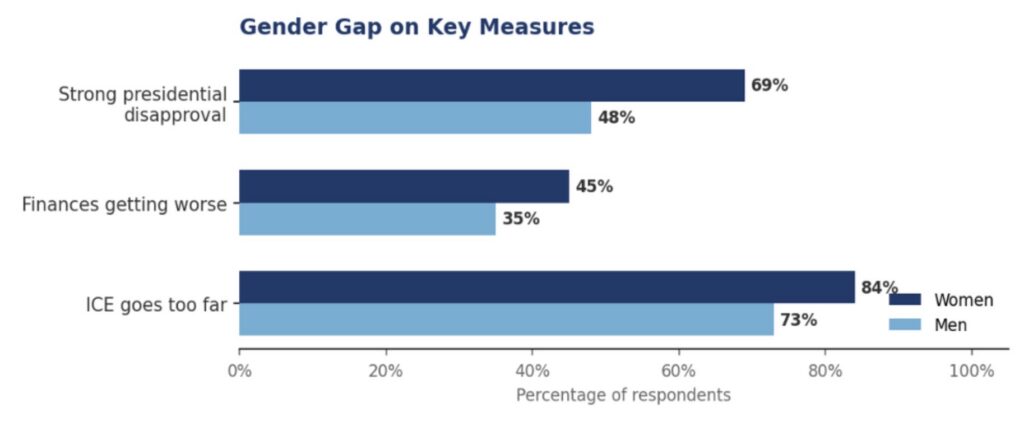
Political Views
Female respondents express stronger disapproval of the President and greater concern about ICE enforcement. They are also more pessimistic about their personal financial situation than male respondents.
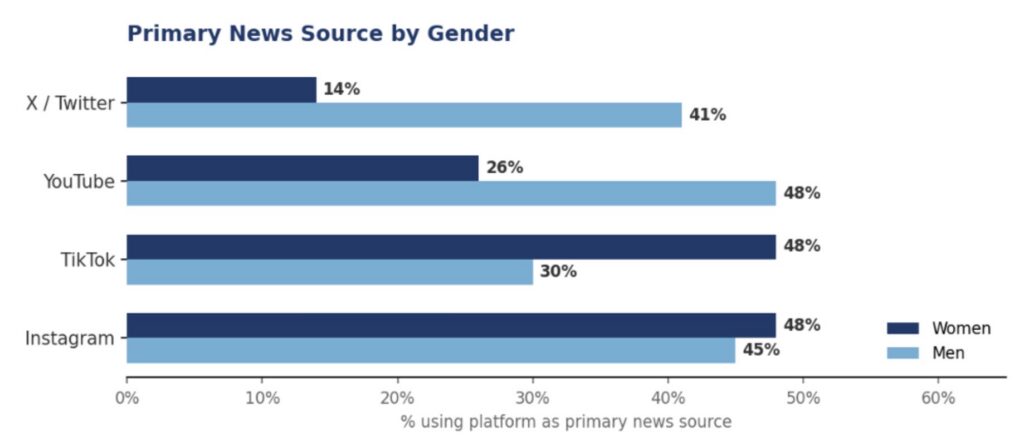
Media and Information Sources
Social media is the dominant news source across the sample. However, male and female respondents rely on different platforms. Female respondents are more likely to use Instagram and TikTok as primary news sources; male respondents are more likely to use YouTube and X (formerly Twitter). Traditional news sources — television, print, and news websites — are used by a smaller but meaningful share of respondents.
These platform differences are substantial. TikTok is used by nearly half of female respondents but fewer than one-third of male respondents as a primary news source. YouTube and X/Twitter is used by nearly half of male respondents but fewer than one-third of female respondents. Instagram is used consistently across gender subgroups.
5) Additional Findings
RACIAL AND ETHNIC DIFFERENCES
Black respondents: Show the highest definite voting intent (57%) and are most likely to say their civic engagement actions definitely had a meaningful impact (50%, compared to 13% of White respondents and 18% of AAPI respondents).
AAPI respondents: Initially report the lowest definite voting intent (26%) but the second-highest level of ICE opposition (86% ICE goes too far).
Hispanic respondents: Show elevated levels of concern across immigration and economic indicators, and report higher civic engagement than non-Hispanics on most measures. 67% describe the economy as weak or very weak (vs. 49). On civic engagement, Hispanic respondents are more likely than non-Hispanic respondents to have posted about political events online (35% vs. 27%), called or wrote to elected representatives (20% vs. 12%), and signed a petition (38% vs. 30%).
VIEWS ON POLITICAL VIOLENCE AND PROTEST
On violent protest, Strong Republicans are far more likely to say it is never acceptable (78% vs. 36% of Strong Democrats). Strong Democrats are more likely to say violent protest is at least rarely acceptable (64% vs. 22% of Strong Republicans).
n=2,027 | Ages 18 – 29 | Fielding Period: 2/26/26 – 3/9/26